
Elmina Castle, built in 1482, sits largely intact on Ghana’s coast as the oldest European structure in Sub-Saharan Africa. In its prime, the castle was used to protect gold trade and hold enslaved people waiting to be shipped to the Americas. Now, the castle is part of a UNESCO-protected world heritage site and a focus of Rochester’s Digital Heritage of West African Monuments Field School.
Under the guidance of Michael Jarvis, an associate professor of history at Rochester, students use photogrammetery and specialized software and several tools, such as a drone and a laser scanner, to map the castle and create 3D models. All of this is work has led to the creation of a “Digital Elmina,” a website that chronicles the efforts to record, analyze, visualize, and preserve Ghana’s cultural heritage buildings.
Behind a lot of the work done by Jarvis and the students is the work of Programmer Josh Romphf and Geographic Information Specialist (GIS) Blair Tinker from the Digital Scholarship Lab. Both have worked with Jarvis in many ways on Elmina and his work in St. George’s Bermuda.
Together, Romphf and Tinker create tools and provide consultation that refine visualizations and increase user accessibility. We asked them to share how they have supported Jarvis’s projects (and those of other faculty members on occasion).
Josh Romphf
Visualizing laser scan data in a web browser
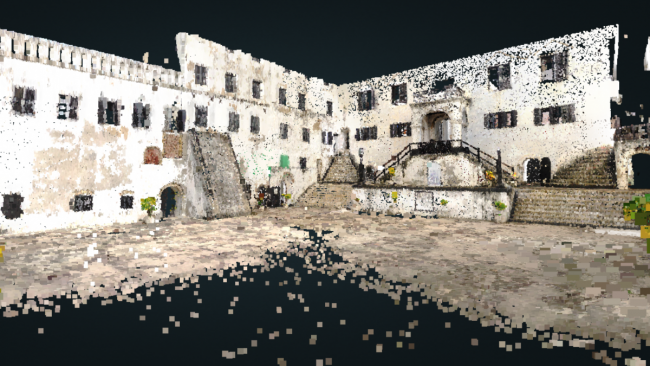
A big part of my work is to develop tools that visualize and provide access to datasets that are inaccessible due to their size or the complexity of the viewing software. I have been working with Dr. Jarvis to process and visualize point clouds captured with his FARO Focus laser scanner. The scans are incredibly accurate but contain an unwieldy amount of data for most consumer-grade computers to process. One solution is to use Potree, an open-source point cloud visualization tool.
Unfortunately, Potree can’t be easily converted. To simplify it and provide greater access to the tool, I cross-compiled the Potree converter from C++ to JavaScript and built a user interface that can be run in a web browser. So now, you can “walk around” part of Elmina. Explore the castle.
Visualizing laser scan data in the Unity Game Engine
Similar to the work above, I've been loading and rendering large point cloud files into the Unity Game Engine. The ultimate goal is to have video-game-like ability to move around in the point cloud data (in two dimensions or virtual reality). I have been working on a Unity add-on for OpenVDB, a C++ library for volumetric rendering developed by Dreamworks. The hope is that we can use OpenVDB to efficiently render the large point clouds and collisions. In short, provide increased access.
Blair Tinker
Education and training
Josh and I have guest-lectured in Dr. Jarvis’s classes several times. We’ve focused mostly on specific software tasks such as creating 3D building models in SketchUp and basic functions in the Unity Game Engine. On my own, I have given talks on what GIS is, and I have overseen small in-class projects to introduce spatial concepts and procedures.
Over the year, Dr. Jarvis has accrued a lot of data from Bermuda and Ghana. I’ve helped him and his graduate students work through it by providing instruction on georeferencing scanned maps, creating data models and layers for spatial data, capturing georeferenced map content, and converting data into alternate formats.
Creating representations that expose spatial relationships
We have created visual representations for both Ghana and Bermuda to help communicate information and eventually analyze spatial relationships. In Ghana, the georeferenced maps and data points (combined with laser scan data) has given Dr. Jarvis information that could influence the location of future digs. In St. George's, Bermuda, properties are being mapped, and data is being collected on who lived at each property and when. Among the outcomes is a map that shows the rise of forts along Ghana’s coast from 1482 to 2019. See the interactive timeline.
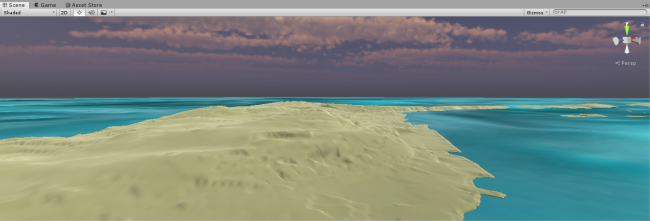
Recreating spaces
Dr. Jarvis has obtained a large amount of GIS data from the Bermudan government and historical maps and images. I had to alter these data in desktop GIS software to create a landscape that once was, but no longer exists. Some areas have been cut away (islands have been altered to allow for shipping), and in other areas, there are now man-made islands (like for the Bermuda Airport). Once the data has been compiled in the GIS software, a conversion process takes place to migrate the data into the Unity Game Engine. At that point, Dr. Jarvis will have access to the model, where he can create an immersive island experience.
If you would like to know more about how the Digital Scholarship Lab supports the digital work of Rochester’s faculty, contact Josh Romphf or Blair Tinker. ∎
Enjoy reading about the University of Rochester Libraries? Subscribe to Tower Talk.
